> For the complete documentation index, see [llms.txt](https://documentation.crossengage.io/llms.txt). Markdown versions of documentation pages are available by appending `.md` to page URLs; this page is available as [Markdown](https://documentation.crossengage.io/predictions-platform/tutorials/analyze-rfm-customers.md).
# Analyze RFM Customers
RFM is a common heuristic technique used to measure customer value. The abbreviation ‘RFM’ stands for ‘recency,’ ‘frequency,’ and ‘monetary value.’ Given the common business knowledge that most of a firm’s business comes from a relatively small number of clients (e.g. the 80/20 rule or the Pareto Principle), it is important not only to track RFM customers, but to see how they develop over time or after a launched Campaign.
{% hint style="info" %}
Tracking how your RFM Customers develop can be a valuable tool for understanding trends in your User Base. However, for launching Print Campaigns, the Model Builder can often choose Customers more effectively, while also offering post-Campaign tools for analysis and improvement.
{% endhint %}
### Identify your RFM customers
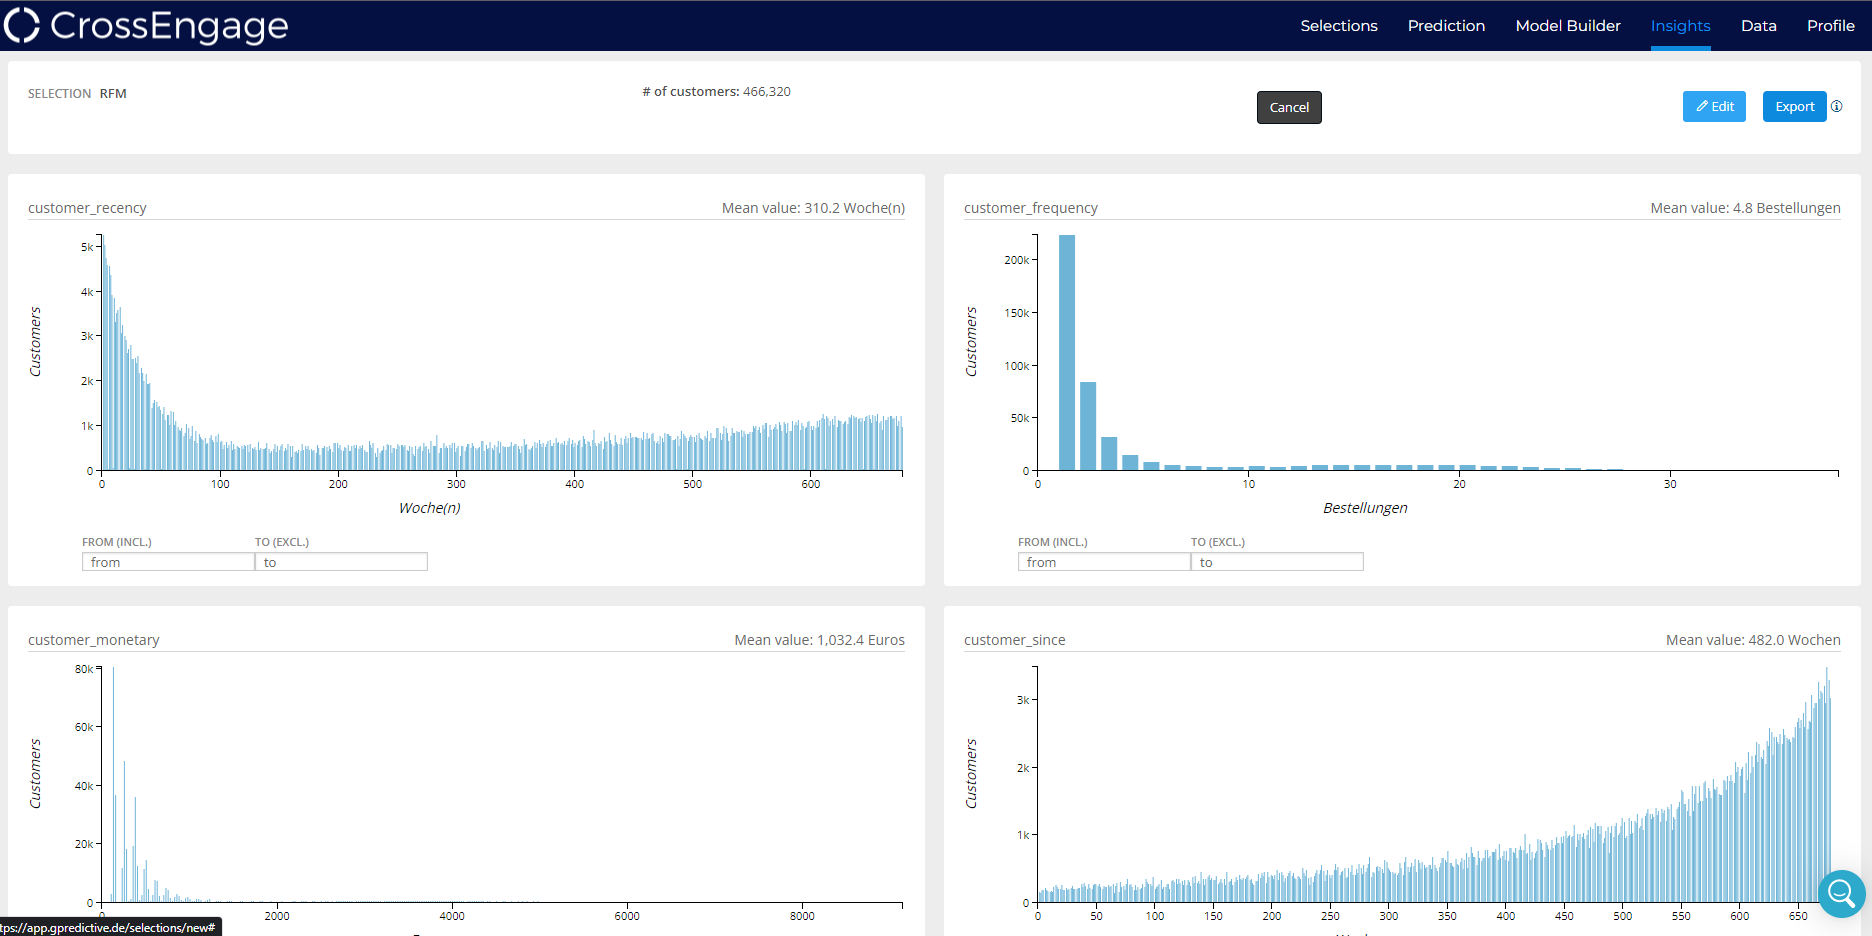
Click on the Insights Tab in the top right of your screen. You will be taken to the Insights page.
* On the Insights page, click the Edit Button in the header.
* Provide a new Selection Name.
* Choose any customers to Blacklist as needed.
* Click apply.
#### Recency
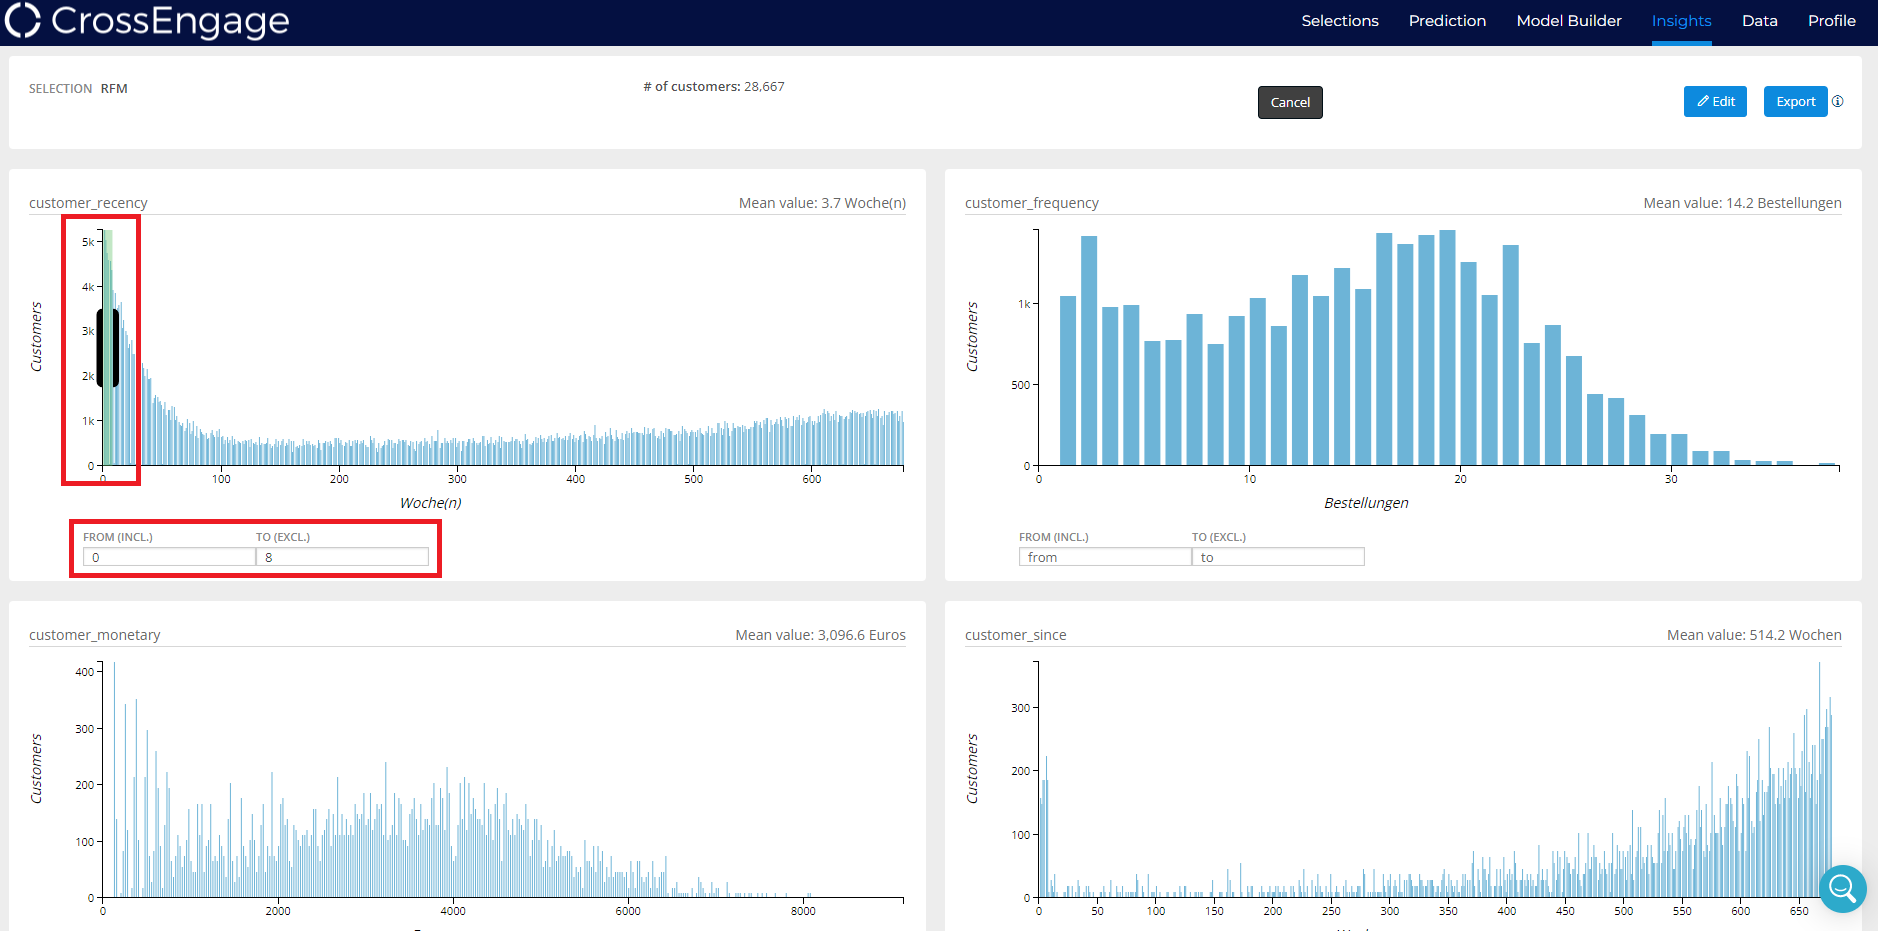
Recency is crucial because the longer it takes for a customer to return, the less likely they are to return at all.
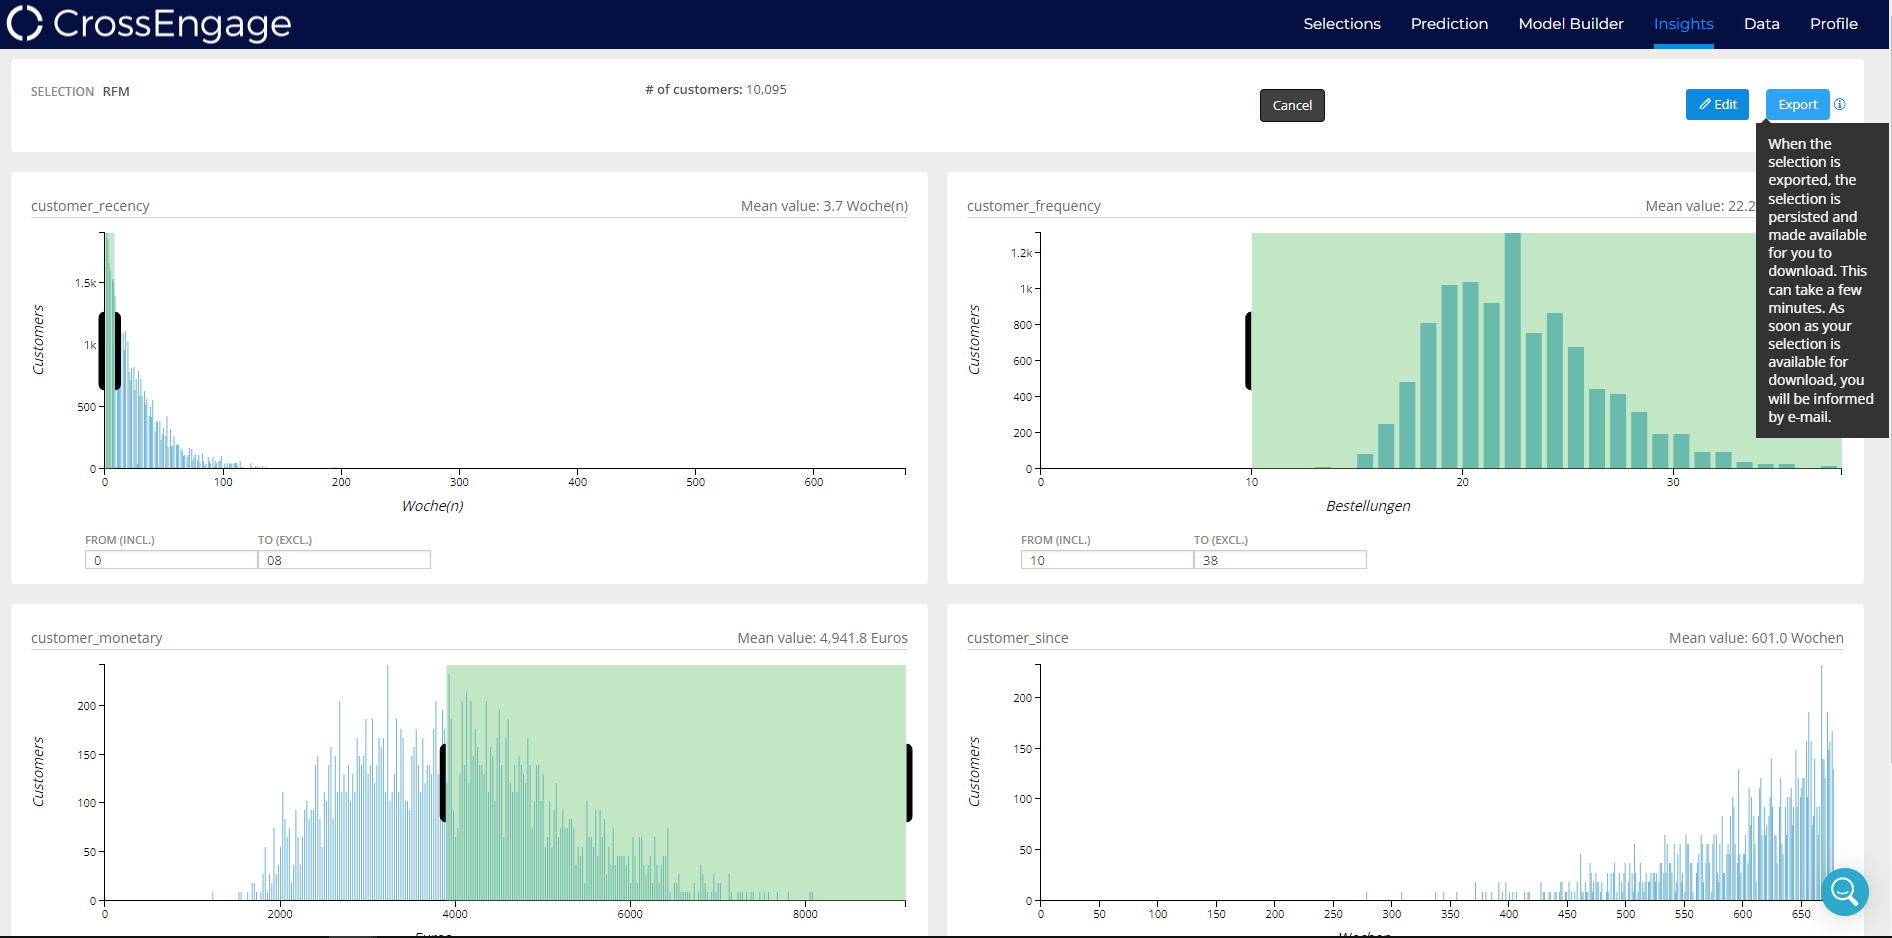
* In the customer\_recency graph, Filter out Customers with Recent Orders. In our example, we are using customers who have ordered within the last 8 weeks.
{% hint style="warning" %}
Please make sure you have recent transaction data available on the Platform, to be able to filter Recency Customers.
{% endhint %}
#### Frequency
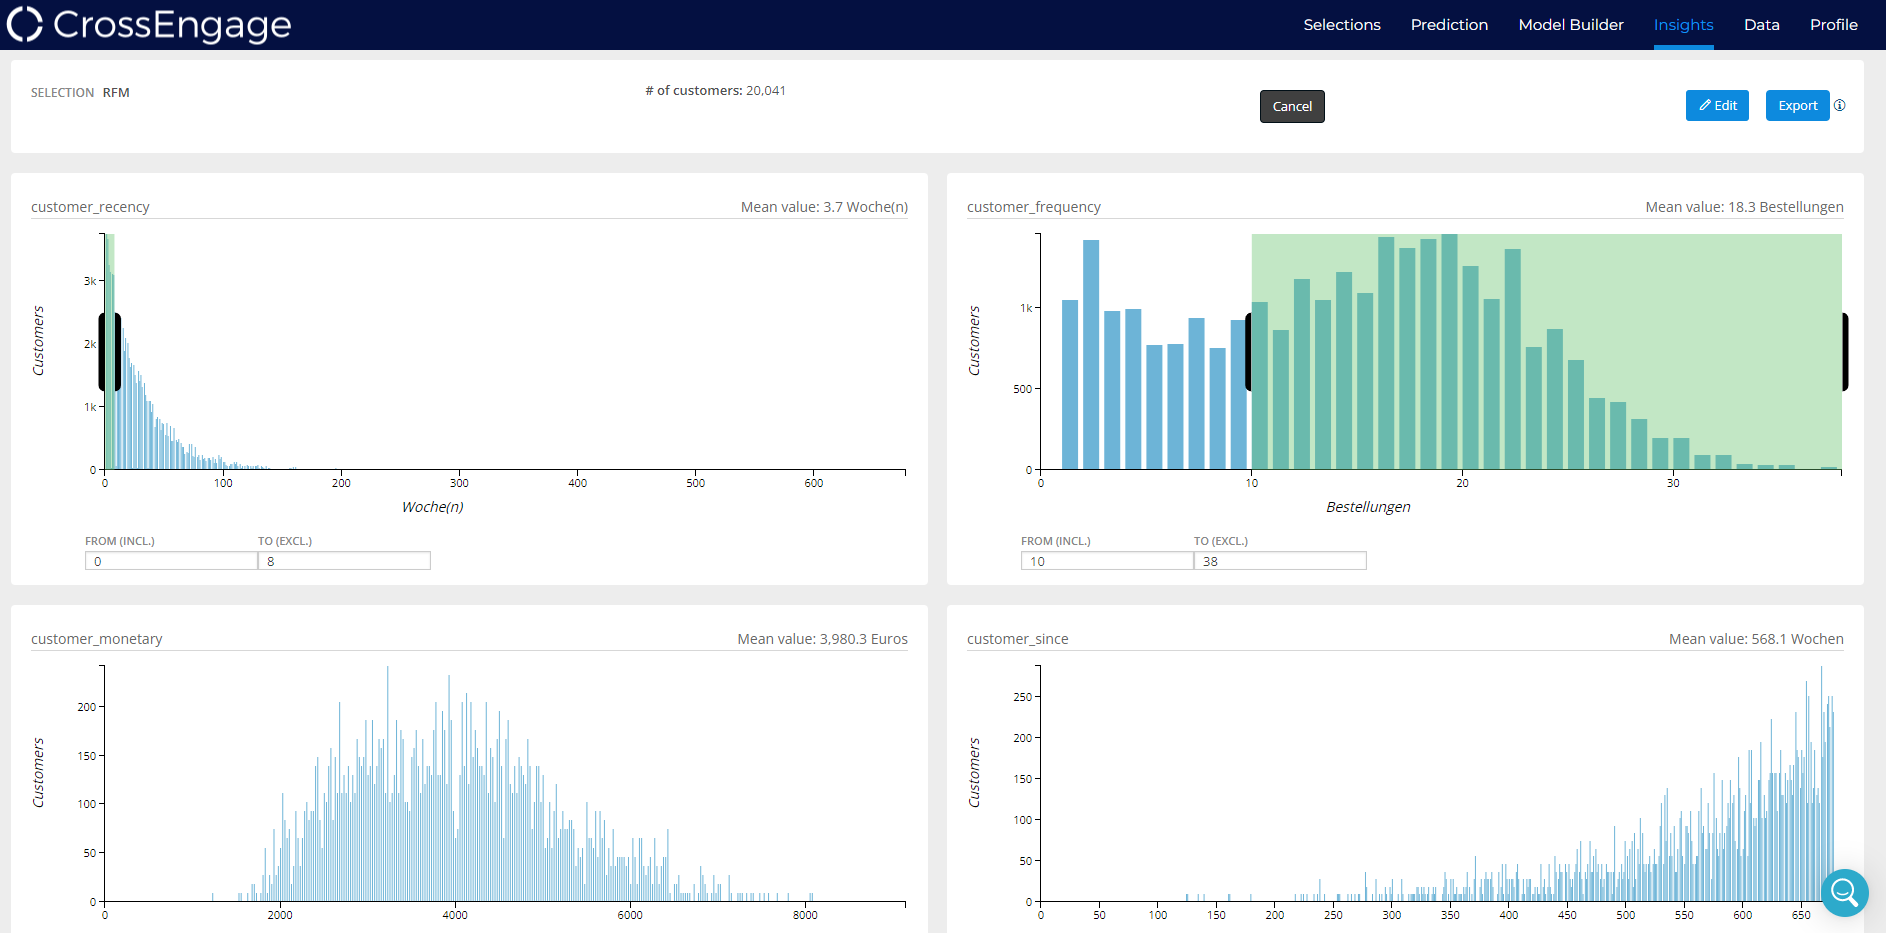
Frequency is also important; it measures the ‘intensity’ of a customer’s relationship with your business.
* In the customer\_frequency graph, Filter out Customers with high Frequency of Orders. In our example, we are using customers who have ordered 10 or more times.
#### Monetary Value
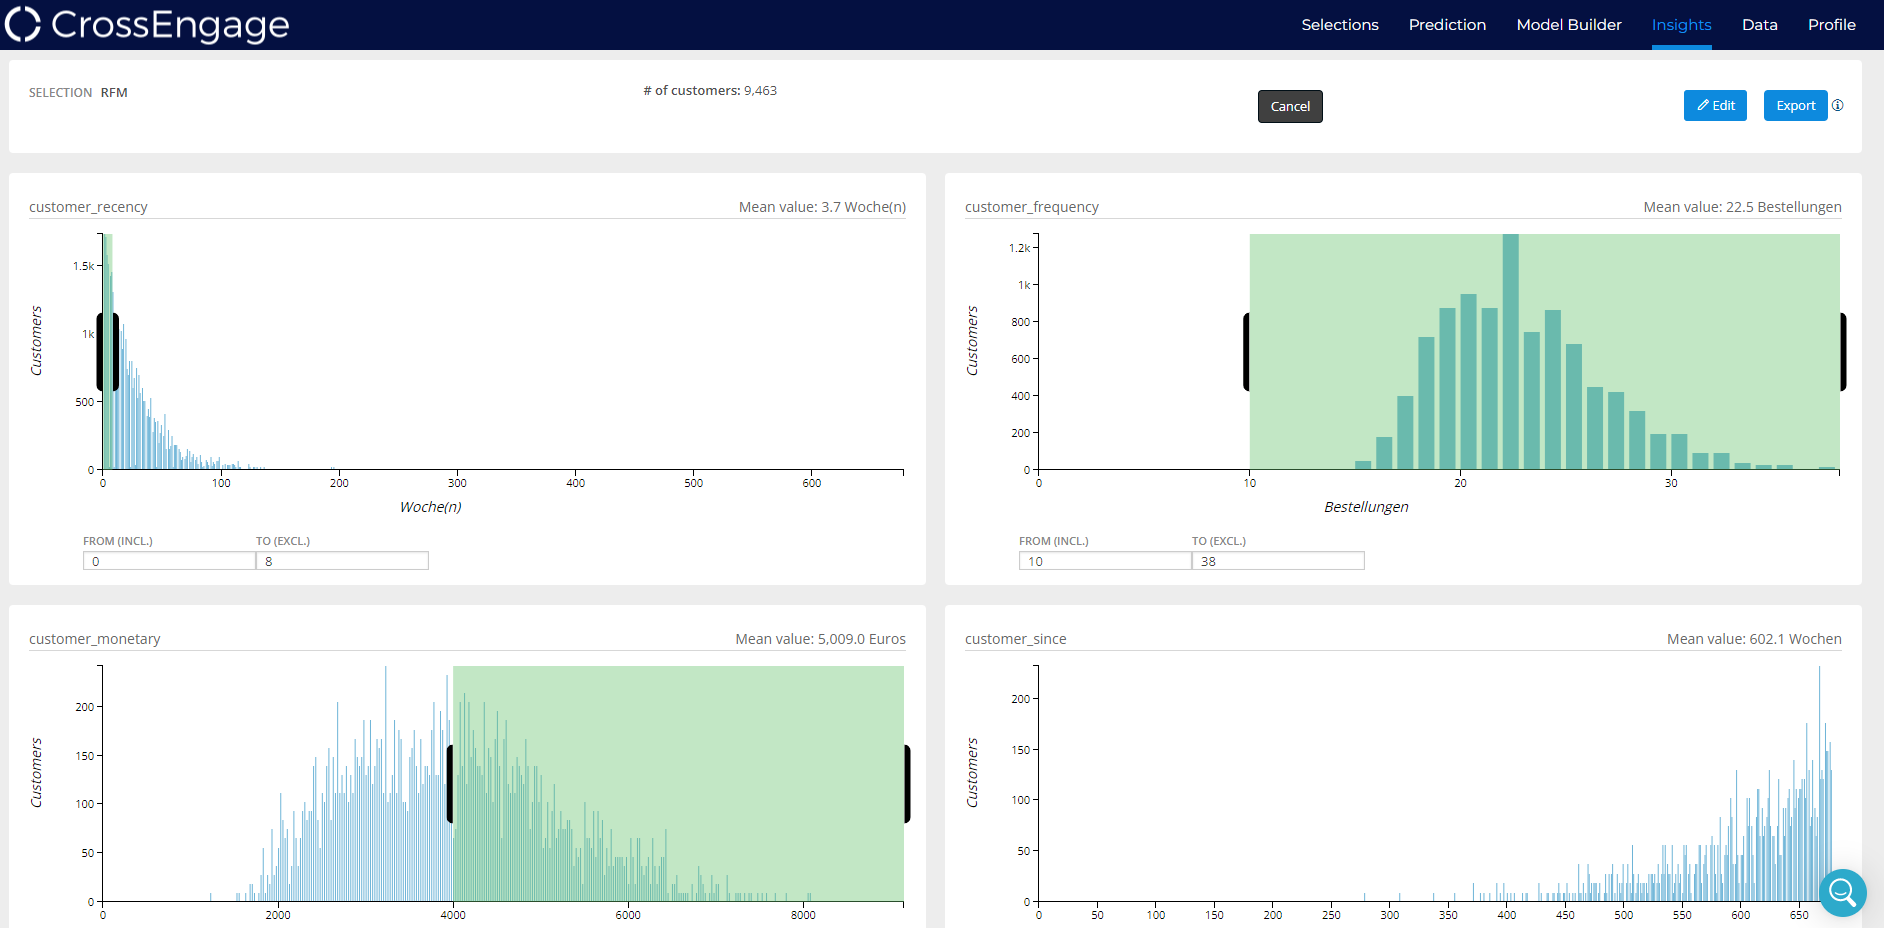
Tracking the monetary value of previous purchases allows you to distinguish between heavy and light spenders, with heavy spenders being preferred.
* In the customer\_monetary graph, Filter out Customers with high Monetary Value. In our example, we are using customers with a value of 4000 Euro or more.
* Adjust the Sliding Filters as needed to increase or decrease the size of the selection. For example, here we adjusted Recency and Monetary Value to identify our top-10,000 RFM Customers.
* Click Export to create a Selection of your RFM customers.